HPLC and LC-MS on a COA: what each method actually proves
HPLC gives you a number without an identity and mass spectrometry gives you an identity without a number — here is how to read them together, and where each one is blind.
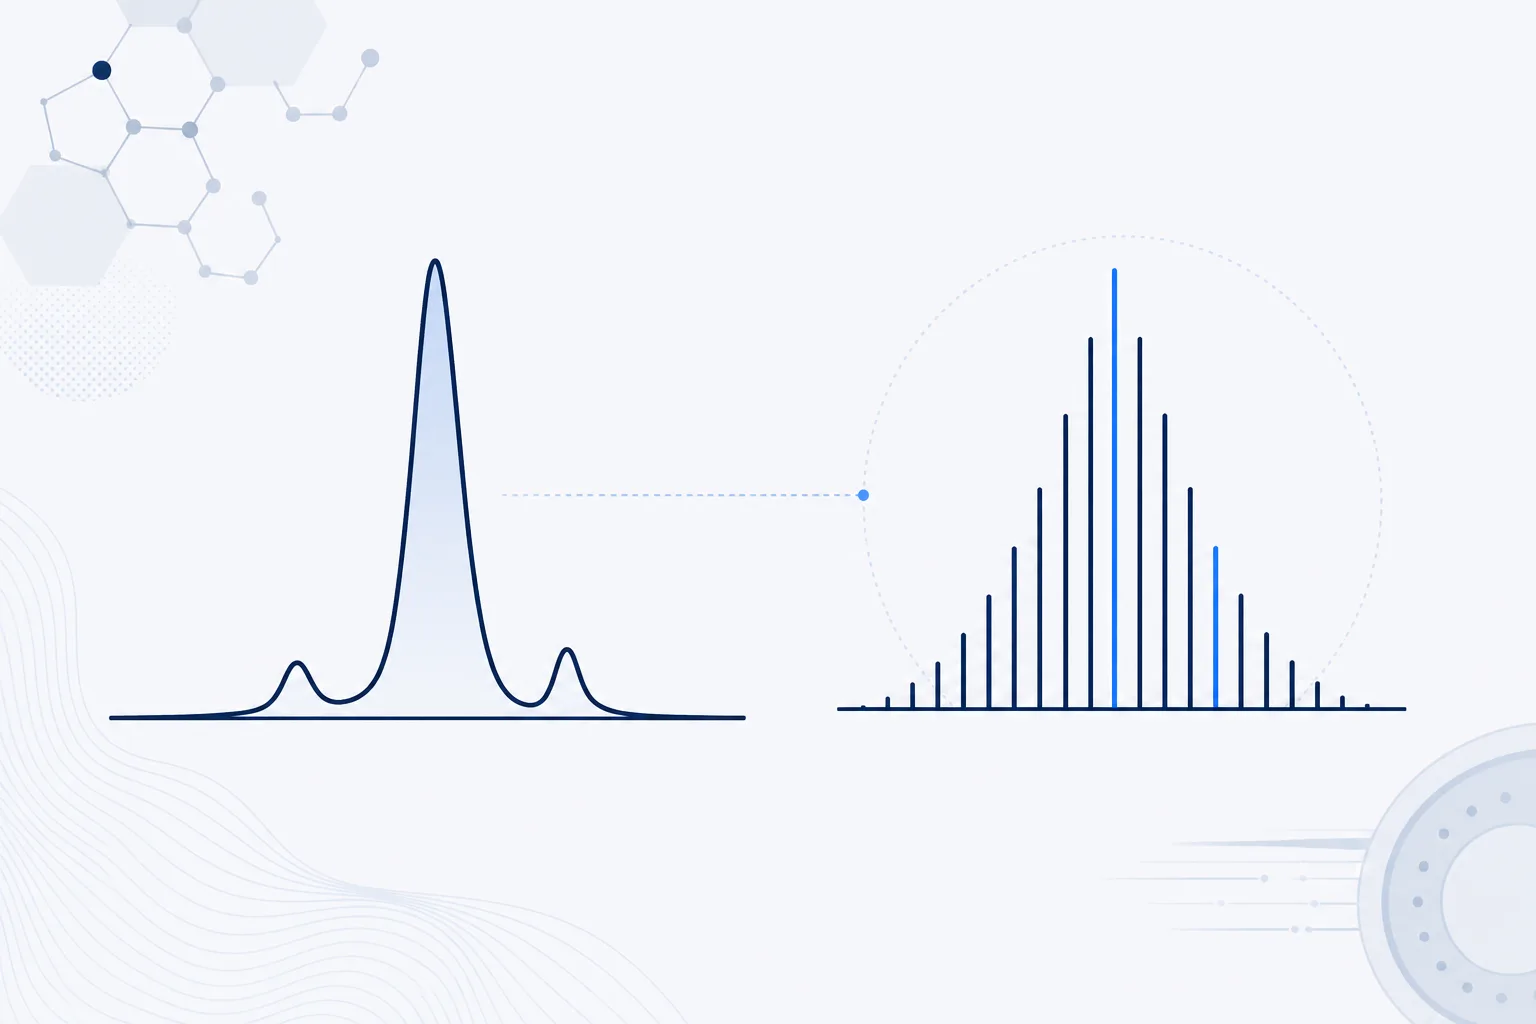
A peptide COA usually carries two analytical annexes: an HPLC chromatogram and a mass spectrum. They are not the same statement made twice. Liquid chromatography with ultraviolet detection answers the question "how much of this material elutes as one single chromatographic entity" and returns a number with no identity attached. Mass spectrometry answers the question "which molecule is the one eluting" and returns an identity with no reliable percentage attached. The two methods are not interchangeable and neither one verifies the other: they close different gaps.
In practice that means two things. The "99.2%" on a COA is an area ratio from the UV detector and says nothing whatsoever about whether the main peak has the right mass. The line "[M+H]+ 1234.6 — conforms" confirms a mass, not a sequence and not a quantity. What actually ties the two together is shared elution: when the spectrum is acquired across that same peak, within a single LC-MS run with parallel UV detection, then — and only then — do you know that the number and the identity refer to the same material. Two independent annexes from two separate runs do not guarantee it.
Two questions that do not substitute for each other
In specification language, identity and purity are separate quality attributes, each with its own test and its own acceptance criteria. General chapter 1503 of the United States Pharmacopeia lists them separately for synthetic peptides: identity, purity and related impurities, net peptide content, counter-ions, water content, residual solvents, microbial burden [1]. The order is not arbitrary. First you establish that the material is the right molecule, then you measure how much of it is the right molecule. A COA that reports a percentage without an identification has measured something precisely without naming it.
What HPLC with UV detection actually measures
The method is almost always reversed-phase chromatography on a C18 column, with a water/acetonitrile gradient in the presence of trifluoroacetic acid, and detection at 214–220 nm, where the peptide bond itself absorbs. The reported purity is the area of the main peak over the summed areas of every peak in the chromatogram. It is a percentage of signal, not a percentage of mass, and the distance between those two is not a theoretical nicety — a longer treatment of what a purity percentage measures and what it leaves out works through where that gap opens widest.
A truncated sequence has fewer peptide bonds, therefore less absorbance at 214 nm, and is under-represented in the figure. Conversely, a fragment that retains tryptophan or tyrosine is over-represented if detection is at 280 nm. Two laboratories reporting "HPLC purity" at different wavelengths are not reporting the same quantity, and comparing their numbers without the method parameters is meaningless. That is why the chromatogram, not the percentage, is the real datum.
- Column: packing chemistry, dimensions, particle size and pore size.
- Mobile phases, the full gradient table, flow rate, column temperature and injection volume.
- Detection wavelength — and, if the detector is a diode array, the acquisition range.
- Scaled axes, total run time and a visible baseline.
- An integration table with retention time, area and area percentage for every peak.
- System suitability results: resolution, theoretical plate count, symmetry factor, injection repeatability [2].
System suitability is where a chromatogram can be judged objectively. The harmonized general chapter 621 of the United States Pharmacopeia defines how resolution, plate count, symmetry factor and signal-to-noise ratio are calculated, and sets the symmetry factor of the quantifying peak at 0.8–1.8 unless the individual monograph states otherwise [2]. A heavily tailing peak integrated as one entity inflates the percentage: the shoulder that disappeared inside the main peak is precisely the impurity the COA is supposed to be measuring.
The other half of the same judgement is the limits. For medicines, ICH Q3A(R2) expresses impurity control as three thresholds: reporting at 0.05%, identification at 0.10% and safety qualification at 0.15% in the ordinary drug-substance case [4]. Research-use-only material is not a drug substance and is not subject to those thresholds. But the shape of the answer — report it, identify it, justify it — is the yardstick against which a COA that simply states "total impurities: 0.8%" with not one peak named is measured.
What a mass spectrum proves — and where it stops
Under electrospray ionisation (ESI) a peptide gives a series of multiply charged ions, from which deconvolution yields the neutral mass; on a MALDI-TOF instrument the singly charged ion dominates. In either case the COA should show three quantities together: theoretical mass, measured mass and tolerance. It should also state which theoretical mass was used, monoisotopic or average. For a peptide of a few thousand Da the two values differ appreciably, and comparing a measured monoisotopic mass against a theoretical average mass produces a "deviation" that is a bookkeeping error, not a chemical finding.
Tolerance is the field most often missing. High-resolution instruments report deviation in ppm, and the acceptance limit commonly quoted in the literature is on the order of 5 ppm; an inter-laboratory comparison study showed, however, that real accuracy depends on the analyser type, the calibration and the measurement methodology, and that a single threshold is not equally demanding across instruments [5]. A nominal-mass spectrum with a tolerance of roughly one Da cannot, by definition, distinguish deamidation, which shifts the mass by 0.984 Da. Without a stated tolerance, two numbers coinciding is not a check.
There is a harder limit as well, and it is the point at which a mass match stops functioning as proof of identity: intact mass is not sequence. Leucine and isoleucine are isomers of identical mass, lysine and glutamine differ by about 0.036 Da, and D-epimers are exactly isobaric with the correct product. Sequence confirmation requires tandem mass spectrometry, and even there the leucine/isoleucine distinction is not automatic: it needs specific fragmentation techniques, such as EThcD with acquisition of diagnostic w ions, developed precisely because conventional fragmentation does not separate them [6]. That is research-grade instrumentation that essentially never appears on a commercial COA. So when the document does not mention MS/MS, the sequence remains a supplier statement.
Why LC-MS is not a measure of purity
A COA reporting "99% purity by LC-MS" is using the right method the wrong way. Signal magnitude in mass spectrometry is not proportional to quantity: it depends on ionisation efficiency, which varies between molecules according to basic or acidic character, hydrophobicity and charge distribution. On top of that, substances co-eluting with the analyte alter the efficiency of droplet formation and evaporation and suppress the signal — a documented phenomenon, addressable only through sample clean-up, chromatographic changes or effective internal standardisation [7]. An impurity that ionises poorly can be abundant and nearly invisible; one that ionises well can look larger than it is.
The correct division of labour is simple: the UV detector — or, for peptides with no usable chromophore, a charged aerosol or light-scattering detector — supplies the area basis, and the mass spectrometer assigns an identity to each peak. The combination is not a luxury: ICH Q2(R2) requires, as the specificity characteristic, evidence that the analyte response is not affected by co-eluting components, and the usual way to demonstrate that is exactly diode-array peak purity or confirmation by mass detection [3]. A main peak that looks like one entity in UV and resolves into two things in the extracted ion chromatogram is the classic case where the percentage was always wrong.
Where one method covers the other's blind spot
The characteristic impurities of solid-phase synthesis are not random: each leaves a predictable signature, either in mass or in retention time, and rarely in both. The table below shows where each method looks for the categories that chapter 1503 describes [1].
| Impurity | Mass shift | Which method shows it |
|---|---|---|
| Methionine or tryptophan oxidation | +15.995 Da | MS clearly; in HPLC it usually elutes earlier |
| Asparagine or glutamine deamidation | +0.984 Da | MS only at high resolution; in HPLC as a shoulder |
| Truncated sequence | minus the residue mass | Both, but UV under-reports the amount |
| Retained protecting group (tBu, Trt) | +56.06 Da / +242.11 Da | MS; in HPLC as a more hydrophobic peak |
| D-epimer (epimerised residue) | 0 Da | HPLC only, as a separate retention time |
| Disulfide-linked dimer | about 2M − 2 Da | MS; in HPLC as a late-eluting peak |
| Trifluoroacetate adduct | +113.99 Da | MS, in the spectrum and not in the chromatogram |
| Counter-ion, water, residual solvents | not represented | Neither — these need separate methods |
The last row is the most important and the least understood: neither HPLC nor mass spectrometry measures how much of the powder in the vial is peptide at all. That is net peptide content, the share of the gross weight that is actually peptide, determined by quantitative amino acid analysis or elemental nitrogen analysis; water content requires Karl Fischer titration and residual solvents require headspace gas chromatography [1]. Two flawless HPLC and MS annexes leave those three fields entirely blank.
The cleanest illustration of complementarity is the pair in the middle of the table. The D-epimer has exactly the same mass as the correct product and is completely invisible to mass spectrometry, yet it often separates chromatographically. The deamidated form, by contrast, can co-elute almost entirely with the main peak and be invisible in UV, while a high-resolution spectrum distinguishes it immediately. Neither method is the "better" one: each is blind where the other sees.
What a COA should show for each method
- For HPLC: full method parameters, the chromatogram itself with scaled axes, a per-peak integration table and system suitability results — not a bare percentage.
- For mass spectrometry: ionisation technique, theoretical mass with an explicit statement of monoisotopic or average, measured mass, tolerance in Da or ppm, and the spectrum itself.
- A statement of whether the mass was acquired across the main chromatographic peak or in a separate infusion of the bulk sample.
- A validation or fitness-for-purpose statement for the analytical procedure, covering the characteristics ICH Q2(R2) defines [3].
- Acceptance criteria beside every measured value; without them a "PASS" is being compared to nothing.
- Identification of the largest impurities where available, at least as an assigned mass rather than an anonymous peak [4].
- Whatever these two methods do not measure, declared separately: net peptide content, counter-ion, water content, residual solvents [1].
Where the evidence is thin
It is worth stating plainly what is not known. There is no published, independent survey of COA quality in the research-peptide market, so any claim about "what suppliers usually do" is an estimate rather than a measurement. The standards cited here are pharmacopoeial and regulatory, written for drug substances [1][2][3][4], and the recent European Medicines Agency guideline on synthetic peptides treats the impurity profile as a matter for systematic documentation using orthogonal methods rather than as a single number [8]. They serve as vocabulary and as a comparison bar, not as a compliance claim.
The line between an analytical and a biological conclusion is thin as well. The literature linking particular impurities to biological effects comes from in vitro experiments and immunoassays, not from studies in humans, and it does not transfer automatically from one context to the other. A COA is an analytical document and nothing more: it records what was measured in one sample, from one lot, by one method, on one date.
The Greek context: accreditation, not approval
The one element of a COA that can be verified independently, with no laboratory and no sample, is the accreditation of the testing laboratory. The international standard for technical competence of testing laboratories is ISO/IEC 17025:2017 [9], which circulates in Greece as ΕΛΟΤ EN ISO/IEC 17025:2017, with accreditation granted by the national accreditation system, Ε.ΣΥ.Δ. [10]. The point that matters for this article: accreditation is granted per method and per scope. A laboratory accredited for purity determination by HPLC is not automatically accredited for identification by mass spectrometry, and the published scope of accreditation states this explicitly.
And one clarification that heads off the commonest misreading: accreditation applies to the laboratory, not to the product. Research-use-only material is not a medicine, holds no marketing authorisation from the Greek national medicines organisation (ΕΟΦ) or from the European Medicines Agency, and falls under no European Pharmacopoeia monograph [8]. Neither the chromatogram nor the mass spectrum changes that status; they record only what one laboratory found in one sample.
References
- 〈1503〉 Quality Attributes of Synthetic Peptide Drug SubstancesUnited States Pharmacopeia (USP–NF), 2021
- 〈621〉 Chromatography (Stage 4 Harmonization, official 1 December 2022)United States Pharmacopeia (USP–NF), 2022
- ICH Q2(R2) — Validation of Analytical ProceduresInternational Council for Harmonisation (ICH), 2023
- ICH Q3A(R2) — Impurities in New Drug SubstancesInternational Council for Harmonisation (ICH), 2006
- Intercomparison study on accurate mass measurement of small molecules in mass spectrometryJournal of the American Society for Mass Spectrometry, 2003
- An EThcD-Based Method for Discrimination of Leucine and Isoleucine Residues in Tryptic PeptidesJournal of the American Society for Mass Spectrometry, 2017
- Ion Suppression in Mass SpectrometryClinical Chemistry, 2003
- Guideline on the development and manufacture of synthetic peptides (EMA/CHMP/CVMP/QWP/367182/2025)European Medicines Agency (EMA), 2025
- ISO/IEC 17025:2017 — General requirements for the competence of testing and calibration laboratoriesInternational Organization for Standardization (ISO), 2017
- Αίτηση για Διαπίστευση Εργαστηρίου κατά ΕΛΟΤ EN ISO/IEC 17025:2017Εθνικό Σύστημα Διαπίστευσης (Ε.ΣΥ.Δ.), 2017